iOS App Analytics: The Complete 2026 Implementation Guide
Master iOS app analytics in 2026. This guide covers key metrics, SDK vs server-side architecture, ATT/SKAdNetwork, and how to build a growth-driven data stack.
Your App Store Connect dashboard says installs are healthy. Firebase says active users are lower than expected. Subscription renewals in StoreKit don't line up cleanly with your growth dashboard. Marketing wants attribution answers, product wants retention answers, and engineering wants to know which SDKs are worth the overhead.
That's the normal state of iOS app analytics now.
Teams don't struggle because they lack tools. They struggle because the data lives in separate systems with different privacy constraints, different identifiers, and different definitions of success. A modern stack has to reconcile App Store acquisition data, in-app behavior, purchase events, entitlement state, experiments, and performance telemetry without assuming perfect user-level visibility.
Why Your iOS App Analytics Are Likely Incomplete
A lot of teams discover the problem indirectly. They launch a feature, see product page traffic rise in App Store Connect, and expect the same lift to appear in their in-app dashboards. It doesn't. Then paid acquisition looks efficient in one tool, noisy in another, and impossible to reconcile in finance.
That mismatch matters because the App Store isn't a side channel. Apple says the global App Store ecosystem facilitated over $1.4 trillion in developer billings and sales in 2025 in its App Store ecosystem announcement. In a market that large, analytics isn't reporting furniture. It's operational infrastructure for product, growth, and revenue.
The real problem is fragmentation
Most iOS teams have at least four data surfaces:
- Store acquisition data from App Store Connect
- Behavioral event data from an SDK such as Firebase
- Purchase and entitlement data from StoreKit, a billing platform, or internal services
- Performance and stability data from Apple tooling, crash systems, or custom logging
Each one answers a different question. None gives you the whole picture.
Practical rule: If one dashboard claims to be your source of truth for iOS, it's probably hiding a major blind spot.
Why this gets worse after ATT
Before privacy changes tightened measurement, teams could pretend a single vendor could follow the full user journey. That assumption no longer holds. On iOS, measurement is partial by design. You need to combine directional acquisition data, behavioral trends, subscription state, and experiment outcomes into one model that your team can trust.
For product teams, that means distinguishing onboarding friction from weak acquisition quality. For growth teams, it means separating paywall issues from attribution noise. For game teams, it means connecting liveops moments, economy changes, and entitlement state without flooding the client with unnecessary SDK work.
If your numbers don't line up today, the stack isn't broken. It's incomplete.
The Core Metrics That Actually Drive Growth
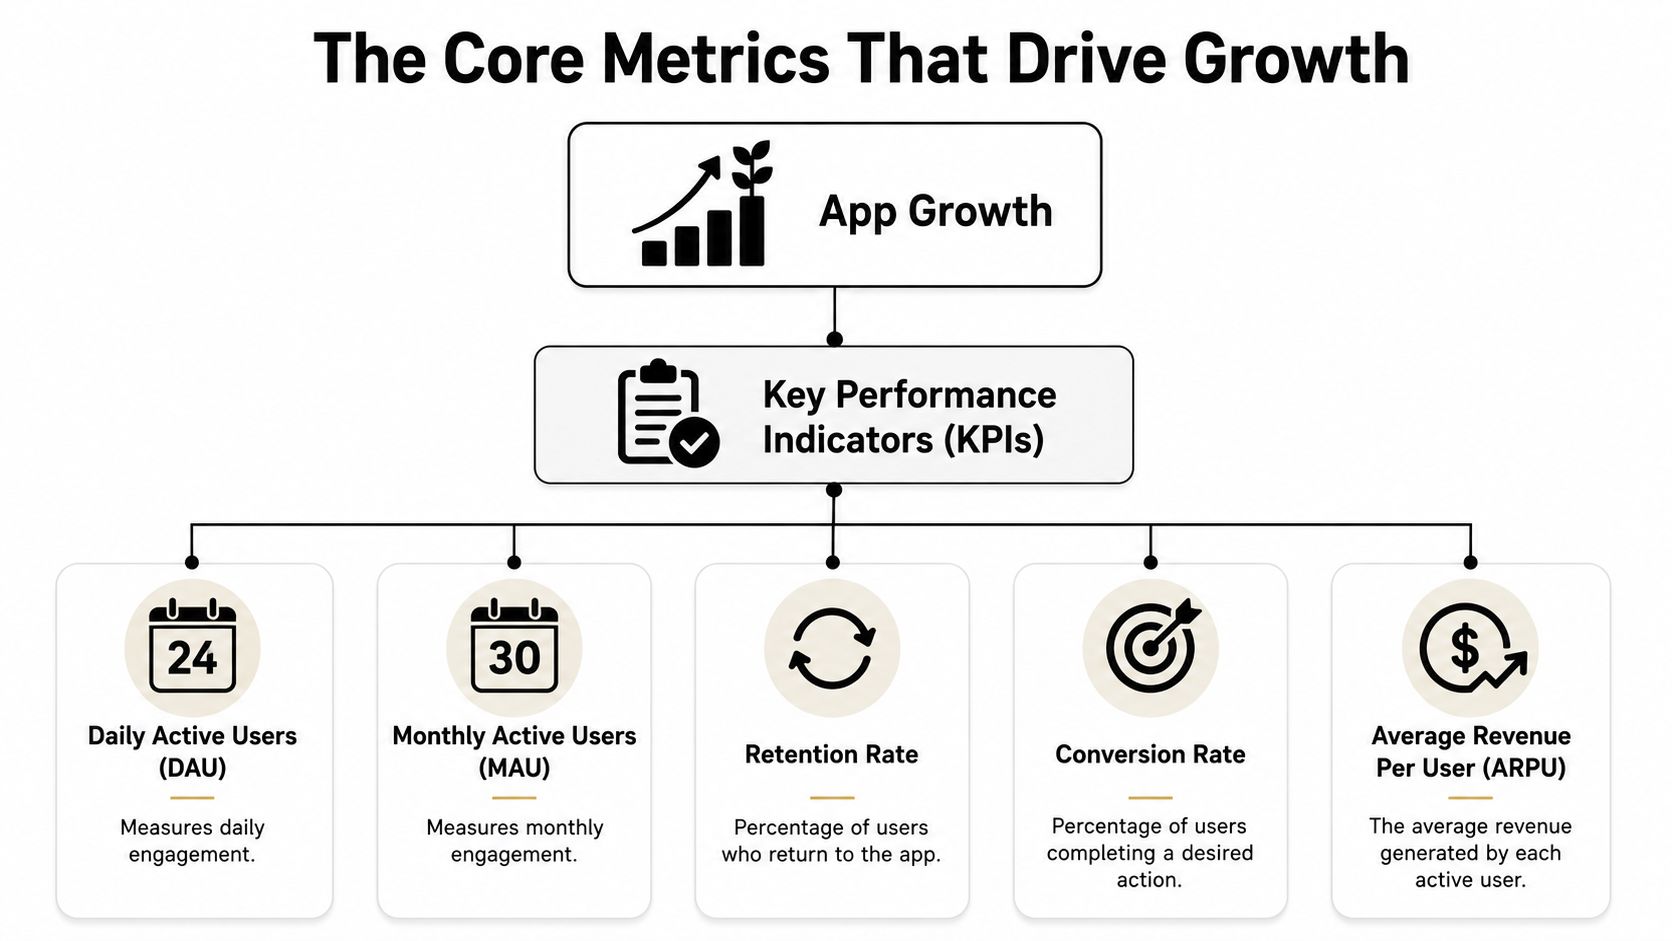
Teams track too much and learn too little. Good iOS app analytics starts with a small set of metrics that answer decisions your team has to make this week.
Engagement metrics
DAU and MAU tell you whether people are forming a habit or just sampling the app. DAU is useful for products with frequent expected usage, such as social, utility, or live service game loops. MAU is better for products with lower natural frequency, such as travel, finance, or creator tools.
Watch them together, not in isolation.
- If DAU rises while conversion stalls, your top-of-funnel or content loop may be healthy but monetization is weak.
- If MAU rises while retention softens, acquisition may be masking a product problem.
- If both flatten after a release, investigate onboarding, app performance, and crash regressions before blaming channel quality.
Retention and funnel completion
Retention answers whether users got the value they expected after install. Funnel completion answers where they failed to get there.
For most apps, the essential funnel isn't “open app and subscribe.” It's more specific:
- Install to first open
- First open to onboarding completion
- Onboarding completion to activation
- Activation to trial start or purchase
- Purchase to retained paid usage
That structure applies whether you're running a subscription app, a commerce app, or a mobile game with in-app purchases. Unity and Unreal teams often have a different middle funnel, but the logic is the same. You want the first meaningful action, the first economy interaction, and the first retained return.
Don't ask whether users “like” the app. Ask whether they reached the first moment where the product becomes useful.
Revenue metrics
ARPU helps growth teams compare monetization efficiency across segments, experiments, and surfaces. LTV matters when you need to decide how aggressively you can buy users, discount trials, or invest in retention campaigns.
Use revenue metrics carefully on iOS because purchase timing, renewals, and entitlement state often live in different systems. If revenue is lagging but trial starts are stable, the issue may be billing flow, paywall packaging, or renewal handling rather than top-of-funnel demand.
The dashboard most teams should build first
A practical first dashboard should answer these questions:
| Question | Metric to use | Decision it drives |
|---|---|---|
| Are people arriving? | New users, first opens | Channel and product page quality |
| Are they reaching value? | Onboarding completion, activation | UX fixes and onboarding experiments |
| Are they coming back? | Retention | Product quality and habit formation |
| Are they paying? | Trial start, purchase conversion, ARPU | Paywall, pricing, offer strategy |
| Are paid users staying paid? | Renewal and entitlement status | Lifecycle messaging and winback |
If a metric doesn't trigger an action, remove it from the top-line dashboard.
Choosing Your Measurement Architecture
The architecture decision shapes everything that follows. It affects data quality, app performance, debugging speed, and how much advantage your team has when privacy limits what any one tool can see.
Client-side SDKs are fast to adopt
Many development teams start with SDKs because they're simple. Add Firebase, define events, ship, and inspect dashboards. That convenience explains why Firebase was integrated into 77 percent of iOS apps as of September 2024, making it the dominant analytics SDK according to Statista's App Store SDK data.
That popularity also creates a trap. If your stack is just Firebase plus a few custom events, you inherit the same limitations as everyone else:
- Client fragility from app state, backgrounding, and network interruptions
- Privacy blind spots where attribution and user-level stitching break down
- Vendor-shaped schemas that push teams into whatever the SDK exposes easily
- Instrumentation sprawl when every feature team logs events ad hoc
SDK-first is fine for early speed. It's weak as a long-term operating model.
Server-side tracking gives you control
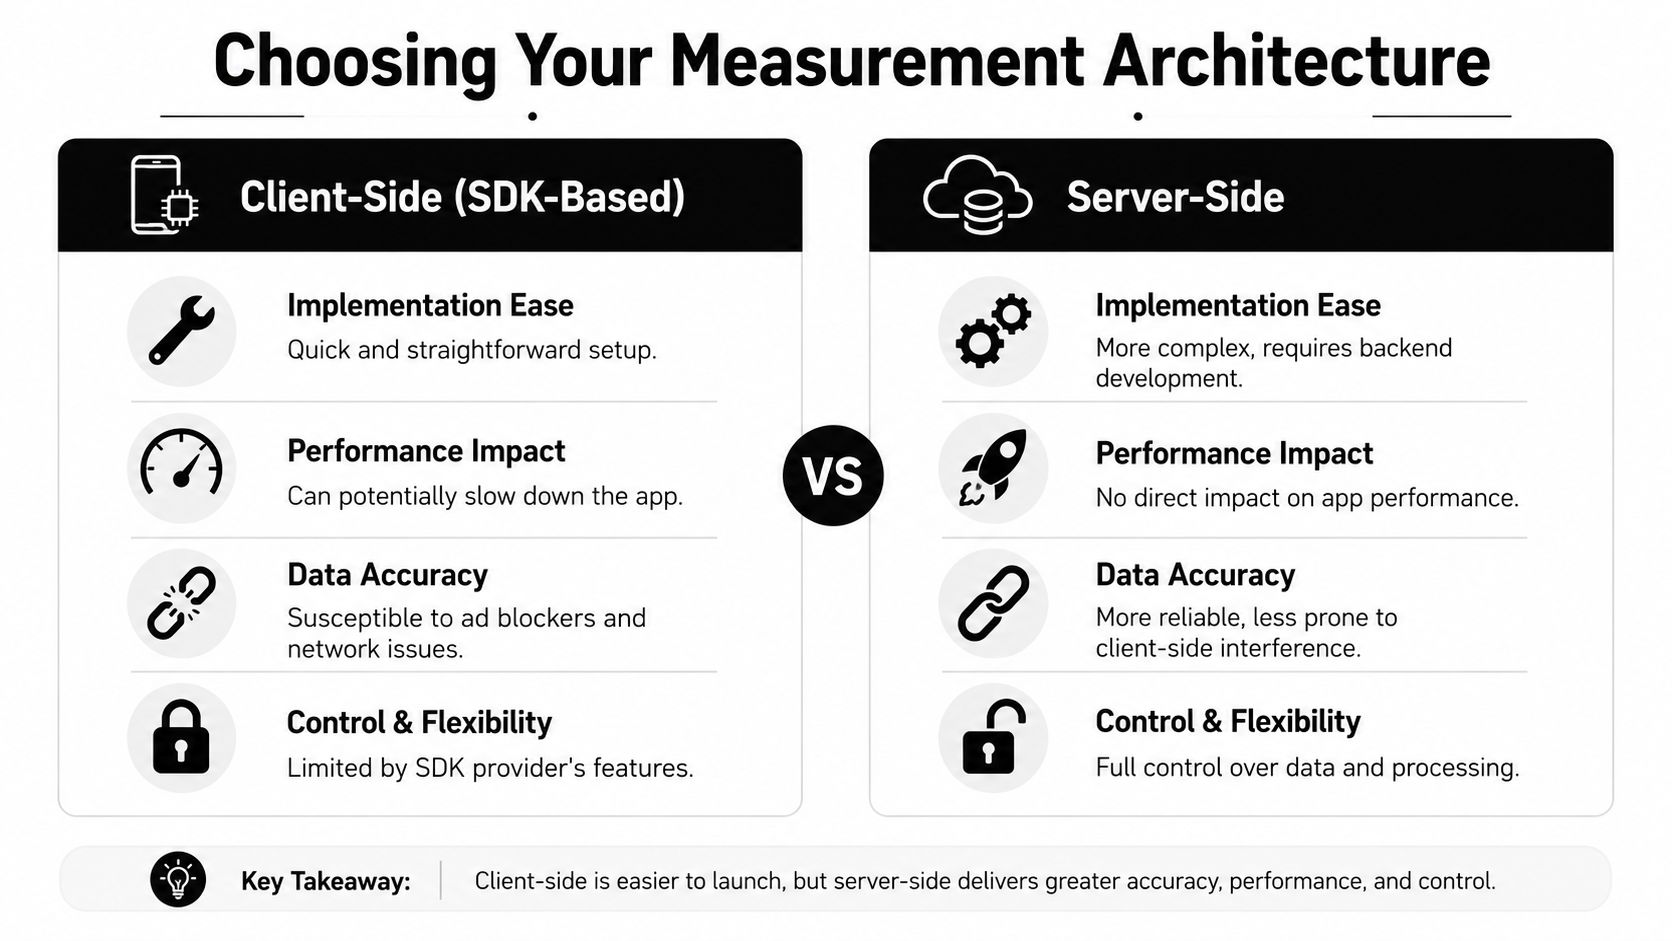
Server-side measurement is harder to implement, but it's better for business-critical events. Purchases, subscription changes, entitlement grants, refunds, backend feature usage, and experiment assignments are safer when recorded on systems you control.
Here's the core comparison:
| Architecture | Best for | Main weakness |
|---|---|---|
| Client-side | UI events, screen views, rapid instrumentation | Can miss or distort events due to device-side constraints |
| Server-side | Billing, entitlement, backend actions, canonical state | Requires backend investment and event design discipline |
| Hybrid | Most serious products and games | More moving parts, so governance matters |
Hybrid is the practical answer
A modern stack usually looks like this:
- Client-side events for taps, screens, onboarding progression, liveops interactions, and local experience context
- Server-side events for purchases, renewals, account state, rewards, entitlement changes, and offer delivery outcomes
- Platform telemetry for crashes and performance, especially when Apple's own device-side frameworks can capture system metrics with low external dependency
- A provider-agnostic workspace that unifies the streams so product, growth, and finance aren't each querying a different truth
For teams comparing vendors, a provider-agnostic layer matters more than another dashboard. You want a system that can ingest from Firebase, native services, game backends, and billing infrastructure without forcing a full rip-and-replace. If you're evaluating options, this overview of mobile app analytics tools is useful for framing the trade-offs.
Your app framework changes the decision
Implementation looks different across stacks.
Native iOS and Android still give the most direct control over instrumentation, runtime behavior, and OS-specific performance tuning. For regulated apps or heavy telemetry workloads, native is usually the cleanest path.
Flutter is a strong option when analytics-heavy UI needs near-native responsiveness. Available benchmarking commentary in this cross-platform development analysis notes that Flutter can require less CPU time and a smaller memory footprint than React Native in comparable scenarios, which matters when your app renders dynamic dashboards or frequent stateful experiences.
React Native can absolutely work, but analytics design needs more discipline because bridge overhead and serialization can amplify bad instrumentation habits.
Unity and Unreal teams should keep gameplay telemetry, economy events, and in-app surface analytics intentionally separate at the schema level, even if they land in one warehouse later. That keeps liveops analysis clean and avoids mixing frame-sensitive game loops with every UI event under the same naming mess.
Navigating iOS-Specific Analytics Constraints
The hardest part of iOS app analytics isn't event logging. It's understanding what you can't see, and refusing to make false-precision decisions anyway.
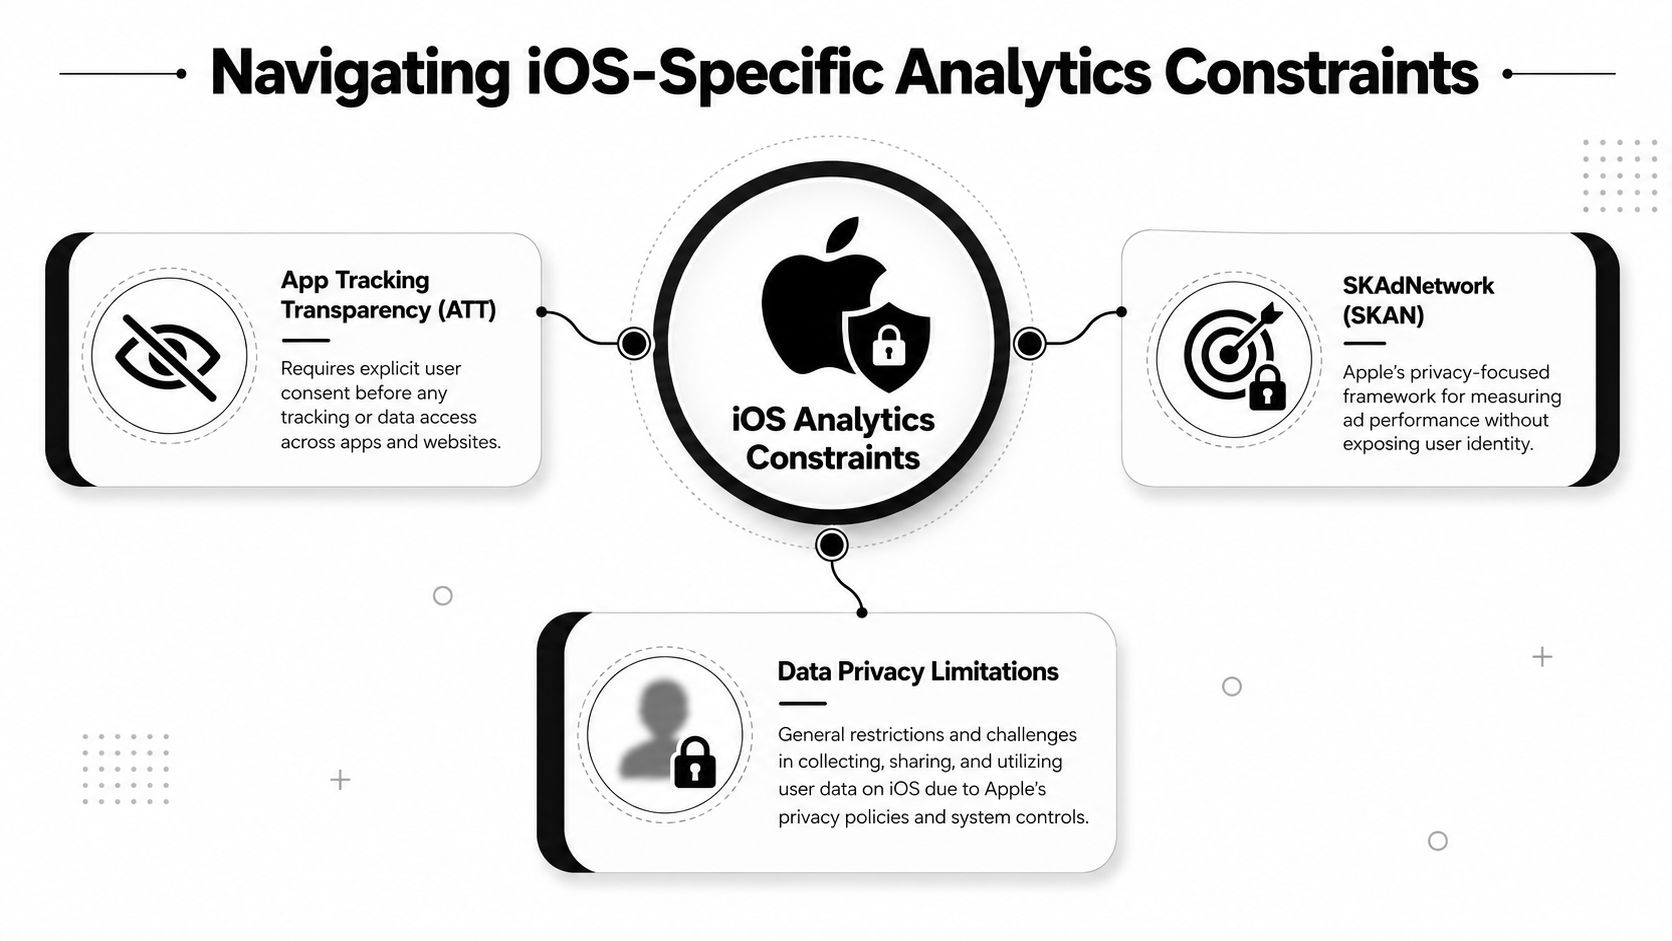
Start with the privacy boundary:
ATT changed attribution, not just ad tech
Apple's App Tracking Transparency framework requires developers to request permission before accessing the IDFA for analytics and attribution. If the app doesn't have permission, the IDFA is returned as a zeroed-out string, as described in this ATT and platform architecture discussion.
That single constraint changes how teams should think about user acquisition:
- User-level attribution becomes partial
- Cross-app identity assumptions stop being reliable
- Channel comparisons become more directional
- Payback models need more humility
A lot of teams still operate as if they can reconstruct a perfect install-to-renewal path for every user. On iOS, they usually can't.
App Store Connect is useful and still incomplete
App Store Connect gives you territory-specific and source-specific store metrics such as impressions, units, proceeds, sessions, and crash rates. It's valuable for top-of-funnel analysis and product page optimization. The same operational guide notes that product page optimization and custom product pages can improve try-to-buy conversion by up to 15 to 20 percent when adjusted for regional behavior in Apple benchmarks, as summarized in this App Store analytics guide.
But it has a major limitation that teams regularly underweight. App Store Connect analytics only capture users who opt in to sharing, which represents roughly 20 to 30 percent of the total user base according to Respectlytics' comparison of App Store Connect and third-party analytics.
That means store-side behavioral trends are often directional, not complete.
If your monetization decisions depend on App Store Connect engagement metrics alone, you're optimizing against a subset of users, not your actual audience.
To handle privacy and logging decisions correctly inside your app, teams should document collection behavior explicitly. A practical reference is Nuxie's guide to iOS SDK privacy and logging.
What to trust for which question
The mistake isn't using multiple data sources. The mistake is asking each source the wrong question.
- Use App Store Connect for store exposure, product page performance, and directional acquisition patterns.
- Use in-app event analytics for onboarding behavior, feature usage, and funnel drop-off.
- Use purchase and entitlement records as the canonical source for paid state.
- Use system-level telemetry for crashes, memory pressure, and performance regressions.
Apple's MetricsKit framework supports on-device collection of CPU, memory, and crash metrics via MXMetricManager and related subscriber interfaces, and discussion in this iOS analytics implementation article highlights the practical trade-off: too much instrumentation can create main-thread contention, UI jitter, and battery cost. That's one more reason not to treat analytics as “free.”
SKAdNetwork is directional by nature
SKAdNetwork helps preserve privacy in ad attribution, but teams get into trouble when they use it as if it were a complete behavioral analytics system. It isn't. Use it for campaign direction, conversion schema learning, and budget guidance. Don't use it as a substitute for product analytics, entitlement reconciliation, or revenue cohort truth.
Designing a Future-Proof Event Taxonomy
Most analytics failures start as naming problems and end as trust problems.
If one team logs subscribe_tapped, another logs paywall_click, and a third logs trial_cta_pressed, nobody can query conversion cleanly across products, platforms, or experiments. That gets worse when iOS, Android, React Native, Flutter, Unity, and Unreal each develop their own habits.
Start with fewer metrics and better definitions
Best practice is to start with around 10 carefully chosen metrics tied directly to business outcomes, not a giant event catalog, as argued in this mobile app analytics guide. That advice is more important on iOS because over-instrumentation doesn't just create dashboard clutter. It can also add SDK load and hurt runtime performance.
Use a tracking plan that every discipline can read:
- Product defines the business question
- Engineering defines the event trigger
- Data defines the canonical property schema
- Growth defines the segment or experiment use case
A good implementation reference is Nuxie's documentation on analytics events and taxonomy.
A naming framework that scales
Use an object_action format for event names. Keep it boring and consistent.
Good examples:
onboarding_startedonboarding_completedpaywall_viewedtrial_startedsubscription_renewedlevel_completedoffer_redeemed
Bad examples:
clicked_continue_buttonfinal_screen_nextrev_event_1premium_yesunity_offer_button_blue
The event name should survive UI redesigns. Button labels, colors, and layout variants belong in properties, not in the core event name.
Plain event names age well. UI-specific event names break every quarter.
Design properties like shared infrastructure
Properties should answer why the event matters and under what conditions it happened.
For example, paywall_viewed might include:
| Property | Why it matters |
|---|---|
placement |
Tells you where the paywall was triggered |
variant |
Connects the event to an experiment |
offer_type |
Distinguishes trial, discount, or standard offer |
entitlement_state |
Separates active subscribers from eligible users |
platform_layer |
Useful in mixed native and cross-platform apps |
What you should avoid:
- Logging duplicate meaning in multiple properties
- Mixing display labels with canonical values
- Capturing sensitive user data unnecessarily
- Creating one-off properties for every experiment
Prune after launch
Good taxonomies aren't static. Review events after release and remove anything nobody uses. Teams that keep every event forever end up with bloated SDK payloads, broken dashboards, and arguments over definitions instead of decisions.
Connecting Analytics to Revenue and Growth
Analytics becomes useful when it changes the app experience.
A clean stack should let you observe behavior, segment users, test an intervention, and measure commercial impact without waiting for a full client release every time. That applies to onboarding, retention offers, feature announcements, surveys, and paywalls.
The loop that actually matters
For growth teams, the loop is simple:
- Detect a bottleneck
- Build a segment around the affected users
- Ship a targeted experience
- Measure revenue, retention, or activation impact
- Keep or roll back based on outcome
That's much easier when analytics, experimentation, in-app experience delivery, billing data, and entitlement state can work together. If those systems are disconnected, your team spends more time exporting CSVs than improving conversion.
Why purchase data needs to be first-class
For subscription apps and games with premium access, purchase events alone aren't enough. You need the current entitlement state, not just the original transaction. That distinction matters when someone churns, restores access, upgrades, downgrades, or receives promotional access.
Provider-agnostic billing infrastructure is strategically useful. Nuxie describes a model where billing and entitlement infrastructure can sync purchase data directly into analytics and growth tooling without charging a revenue-share fee, which changes the economics and the data path for monetization teams in its provider-agnostic billing overview.
Good growth stacks connect three layers
Behavioral layer
This tells you what the user did. Examples include onboarding completion, feature usage, paywall exposure, or game economy interaction.
Decision layer
This determines what should happen next. Should the user see a trial offer, a survey, a retention prompt, a liveops moment, or nothing at all?
Commercial layer
This confirms whether the experience changed revenue or paid retention. That means purchase state, renewals, offer redemption, and entitlement status need to flow back into analysis.
For cross-platform teams, the architecture should work across native iOS and Android, plus React Native, Flutter, Unity, and Unreal. The UI surface may differ, but the loop is the same. Observe, decide, act, measure.
The most expensive analytics gap isn't missing a dashboard. It's running an experiment that can't be tied cleanly to purchase and entitlement outcomes.
Where paywalls fit
Paywalls matter, but they shouldn't dominate the design of your stack. Treat them as one monetization surface among many. The same system should support onboarding branches, feature education, lifecycle prompts, game offers, and post-purchase experiences. That's how analytics becomes a growth engine instead of a passive reporting layer.
Your iOS Analytics Implementation Checklist
If your stack is messy, don't rebuild everything at once. Audit it in sequence and fix the parts that block decisions.
Step 1 to 3
Define the business questions first. Decide which outcomes matter now: activation, retention, trial starts, subscription conversion, ad monetization, liveops participation, or renewal health.
Choose a small KPI set. Keep the top-line dashboard limited to the metrics that drive action. If a number doesn't trigger an owner and a response, it doesn't belong.
Map your data sources by role. Identify which system owns store acquisition, behavioral events, purchase records, entitlement state, and performance telemetry.
Step 4 to 6
Separate canonical events from convenience events. Purchases, renewals, grants, and backend state changes should come from controlled systems, not only from the client.
Design the event taxonomy before adding more SDK code. Standardize names, properties, and trigger rules across iOS, Android, React Native, Flutter, Unity, and Unreal where applicable.
Review performance impact. Audit SDK count, event volume, and any heavy instrumentation on hot paths such as onboarding, checkout, and gameplay loops.
Step 7 to 9
Build dashboards around decisions, not departments. A product dashboard should reveal onboarding friction. A growth dashboard should reveal offer performance. A finance-facing dashboard should reconcile paid state and proceeds cleanly.
Document privacy assumptions. Make it explicit where ATT, App Store Connect opt-in behavior, and SKAdNetwork limit certainty so nobody mistakes directional data for exact truth.
Create an experiment feedback loop. Every experiment should have a clear audience definition, event exposure marker, success metric, and rollback rule.
Step 10
- Schedule pruning. Remove unused events, deprecated properties, and stale dashboards on a regular cadence. Analytics quality improves when the schema gets simpler, not larger.
Teams that do this well don't collect the most data. They build the cleanest path from user behavior to product and revenue decisions.
Nuxie helps teams build that path without locking themselves into a single vendor. It combines a provider-agnostic analytics workspace, in-app experiences, experimentation, billing, purchase sync, entitlement infrastructure, and an AI-native growth agent across Nuxie supported platforms including iOS, Android, React Native, Flutter, Unity, and Unreal. If your current stack is split across separate SDKs, paywall tools, and billing systems, Nuxie is built to work alongside existing tools or replace them over time, without charging a revenue-share fee for billing and entitlement data.