
App Analytics: The Ultimate Guide for Mobile Teams (2026)
The ultimate 2026 guide to app analytics. Learn core metrics, event design, funnels, attribution, and implementation for iOS, Android, and cross-platform apps.
You shipped the feature. Design signed off, engineering closed the tickets, marketing queued the push. A week later, the pertinent questions arrive. Did people even find it? Did it help conversion, or just add friction? Did Android users hit something iOS never saw? Did your game economy improve, or did your store screen just get noisier?
That's where many organizations discover whether they have app analytics or just event exhaust. A few charts in Firebase, some billing data in one tool, attribution in another, session replay somewhere else, and no shared taxonomy across iOS, Android, React Native, Flutter, Unity, or Unreal. The result isn't a lack of data. It's a lack of trust.
Good app analytics gives product, growth, engineering, and game teams a common operating system. It tells you what users did, what they tried to do, what broke, what converted, what retained, and what only looked important because your most engaged users touched it first.
Why App Analytics Is Your Most Critical Growth Tool
Most mobile teams don't fail because they stop shipping. They fail because they keep shipping without learning fast enough. In a mobile product, every release changes behavior somewhere. Onboarding shifts activation. A revised paywall changes proceeds per payer. A new feature announcement helps one segment and annoys another. Without instrumentation, those changes are guesswork wearing a dashboard costume.
That's why app analytics has moved from reporting layer to core infrastructure. The market reflects that shift. The global app analytics market was valued at USD 3.99 billion in 2024 and is projected to reach USD 20.35 billion by 2032, with a CAGR of 22.56%, driven by enterprises treating in-app insight platforms as mission-critical for customer experience and monetization, according to Data Bridge Market Research.
What strong teams actually use it for
The practical use cases are rarely abstract. Teams rely on app analytics to answer questions like these:
- Onboarding health: Where do users stall before first meaningful action?
- Monetization clarity: Which paywall entry points create intent, and which ones interrupt it?
- Feature adoption: Do users discover the feature, return to it, and use it again later?
- Technical quality: Are freezes, input delays, or entitlement sync issues hurting conversion before crash reporting catches anything?
- Cross-platform parity: Does the same flow behave differently on Swift, Kotlin, React Native, Flutter, Unity, or Unreal?
Those answers directly affect roadmap priority. A product manager should know whether to fund a checkout redesign, a rendering fix, a push reactivation campaign, or a pricing test. Analytics is how you stop arguing from anecdotes.
Practical rule: If a feature can change revenue, retention, or support load, it needs instrumentation before launch, not after the postmortem.
Vanity metrics won't help you ship better
New teams often start with installs, DAU, and total revenue. Those metrics matter, but they're lagging and too broad to guide product work. If your retention slips, you still need to know whether the cause was friction in sign-up, an entitlement bug, poor feature discovery, or a degraded experience on a specific device class.
Useful app analytics is narrower and closer to user intent. It ties event streams to actual decisions. Keep the top-line business metrics, but connect them to user journeys, lifecycle moments, and technical signals your team can act on this sprint.
A mature stack doesn't just tell you what happened. It helps you decide what to fix next.
The Anatomy of App Analytics Data
Before you build dashboards, define the parts of the system. Most failures in app analytics come from fuzzy data models, not weak charting. If one team logs purchase_complete, another logs subscription_success, and a third only trusts StoreKit callbacks, nobody can compare anything.
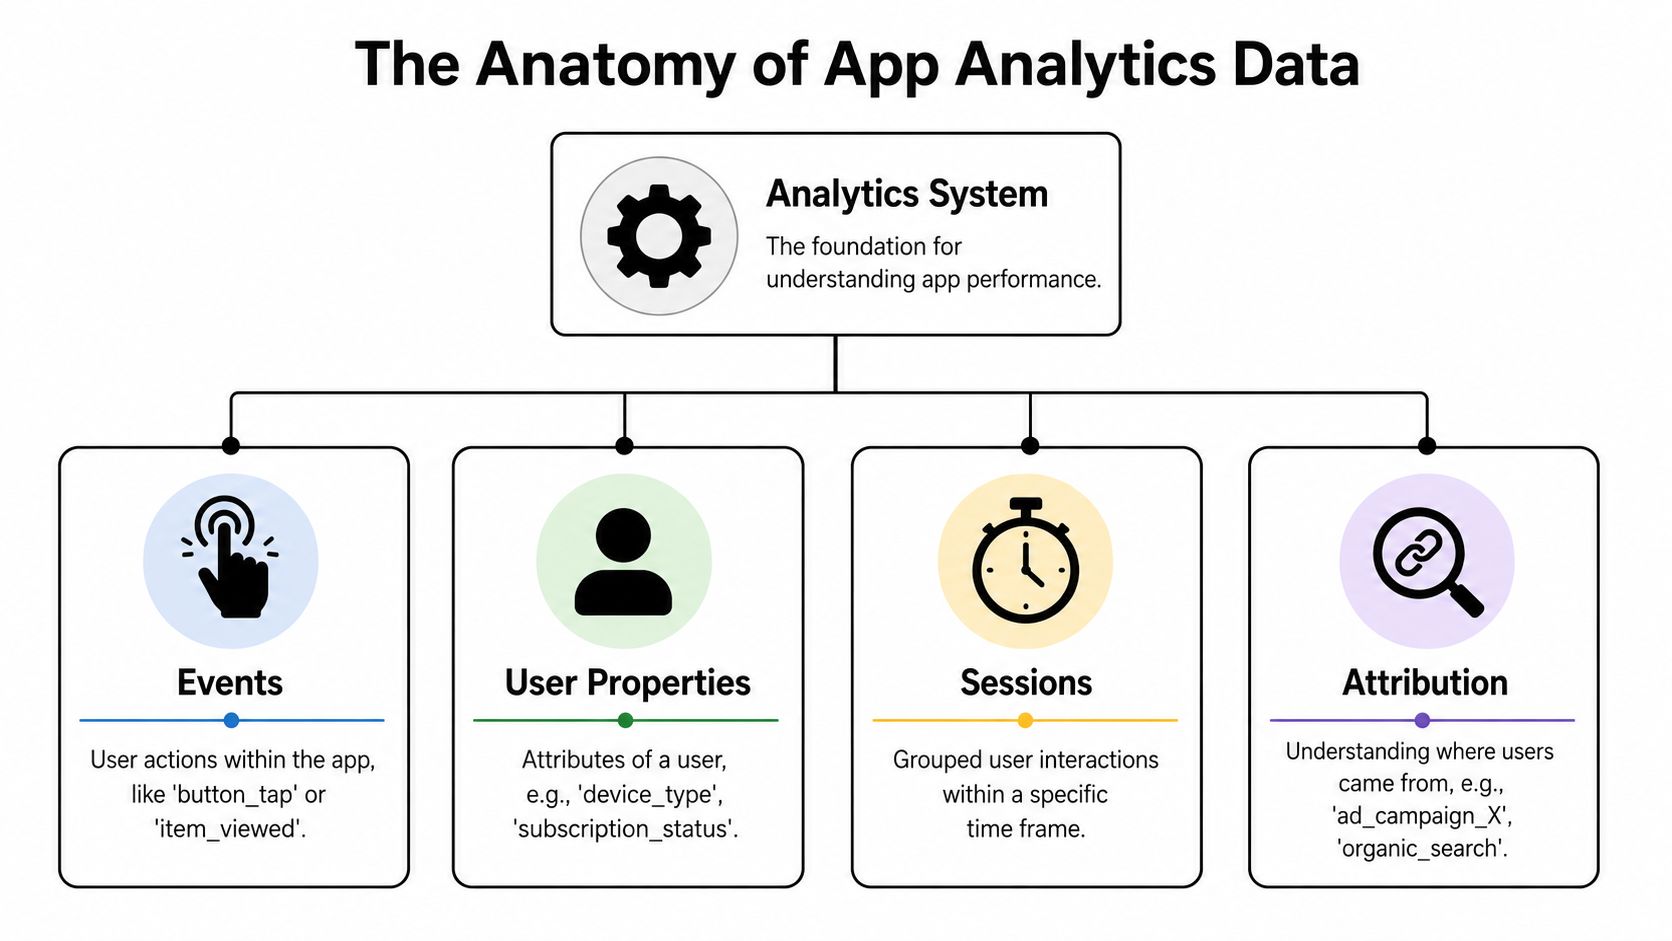
At the base level, you need four concepts: events, user properties, sessions, and attribution.
Events and properties
An event is a thing that happened. A button tap. A level completed event in a game. A paywall viewed. A survey dismissed. An entitlement refresh failed. Events should capture intent or state change, not random UI noise.
Event properties add context to that action. If the event is paywall_viewed, the properties might include placement, offer type, screen name, product set, or experiment variant. If the event is level_completed, properties might include level ID, character class, or session source.
A simple way to view this:
| Component | What it answers | Example |
|---|---|---|
| Event | What happened | onboarding_step_completed |
| Event property | What was true when it happened | step_name=permissions_prompt |
| User property | What's persistently true about the user | subscription_status=trial |
| Session data | What happened in one usage window | source, duration, sequence |
Users aren't always devices
Mobile teams get this wrong all the time. A device is not a user. One person can install on iPhone and iPad. One household tablet can represent several people. A user might reinstall and get a new device ID. If your analytics stack treats all of that as one thing, retention and conversion analysis will drift.
For implementation, define identity rules early:
- Anonymous state: Before login or purchase restore, use a stable app instance identifier.
- Known user state: Once authenticated or reliably linked, merge to a user ID you control.
- Billing state: Keep purchase and entitlement identifiers separate from product analytics IDs, then map them intentionally.
That separation matters for subscriptions, consumables, and entitlement support. It also matters in games, where one account may span mobile and other surfaces.
When identity rules are vague, every downstream chart becomes a debate about data quality instead of product behavior.
Sessions and attribution aren't optional
A session groups user behavior into a bounded period of activity. It helps you understand sequence. Did the user open the app, hit the store, view the paywall, background the app, and come back later to convert? Sequence often matters more than raw event counts.
Attribution tells you where the user came from or what brought them back. That might mean campaign source, deep link, push notification, referral, or organic return. Even if you use a dedicated attribution partner, preserve the key source fields in your event stream so product and growth can analyze behavior in the same workspace.
Performance data belongs beside product data
If you only track business events, you'll miss the technical friction that explains them. One of the most useful examples is frustration telemetry. Apps with UI-freeze rates above 2% experience a 15 to 20% higher drop-off rate during onboarding, and reducing this kind of friction often results in a 10 to 12% improvement in Day-1 retention, based on the UXCam analysis of rage taps and UI freezes in important mobile app analytics metrics.
Crash-free rate alone won't catch that. A user who rage taps an unresponsive button doesn't always crash. They just leave.
For technical PMs, that means performance instrumentation should sit in the same review loop as onboarding and monetization metrics. If your paywall underperforms only on devices with visual latency, the fix belongs with engineering, not pricing.
Designing Your Event Tracking Plan
A strong tracking plan starts with business decisions, not event volume. If you ask engineers to “track everything,” you'll get noise, duplicates, and taxonomy drift. If you start from the questions the team needs answered, you'll collect less data and get more value.
Start from decision points
List the decisions your team expects to make in the next two quarters. Common ones include:
- Subscription optimization: Which paywall placements and offer structures deserve more traffic?
- Activation improvement: Where do users abandon onboarding before first value?
- Feature rollout health: Did the newly shipped feature get discovered and repeated?
- Game economy tuning: Which shop, reward, or liveops moments lead to sustained purchase behavior?
- Retention intervention: Which moments justify an in-app reminder, survey, or winback screen?
Each decision should map to a short set of core events. If a decision can't be tied to specific events, the brief is still fuzzy.
Build a taxonomy your developers won't resent
The best naming system is the one every platform team will follow. Keep it boring and strict. Teams often find success with an object-action or domain-action pattern such as paywall_viewed, offer_selected, checkout_started, entitlement_synced, level_completed, or feature_announcement_dismissed.
Use one canonical event spec across iOS, Android, React Native, Flutter, Unity, and Unreal. Then let each client implement it in native conventions.
A practical event spec should define:
- Event name
- Trigger condition
- Required properties
- Optional properties
- User properties to join against
- Owner
- Platforms covered
- QA notes
If you need a model for this, Nuxie's events and taxonomy documentation is a good example of how to keep naming, property rules, and implementation aligned across product and engineering.
Track meaning, not taps
A common mistake is over-instrumenting low-level UI interactions and under-instrumenting meaningful transitions. Ten button taps may represent one intent. One entitlement mismatch may explain a wave of support tickets.
Use this filter before adding any event:
| Keep it if it helps answer | Skip it if it only says |
|---|---|
| Did the user discover value? | They tapped around on one screen |
| Did the user complete a key transition? | The UI rendered another component |
| Did monetization or entitlement state change? | A generic modal appeared |
| Did technical friction block progress? | The user scrolled a list |
Define properties with restraint
Properties are where tracking plans become either useful or impossible to maintain. Add properties that support segmentation or diagnosis. Avoid stuffing in every available field just because the SDK allows it.
Good property categories usually include:
- Contextual properties: screen, placement, source, campaign, quest, level, or feature entry point
- Commercial properties: product ID, offer type, billing provider, intro offer eligibility, entitlement state
- Technical properties: app version, platform, framework, network state, failure type
- Experiment properties: variant, audience, rule set, configuration version
A clean event with five trusted properties beats a bloated event with twenty fields nobody can query consistently.
Version your plan like product code
Instrumentation changes are product changes. Treat them that way. Put the tracking plan in version control, review schema changes in pull requests, and assign ownership. When teams don't do this, dashboards break unnoticed after refactors, and nobody notices until finance, growth, and product all report different numbers.
The tracking plan is the contract between app code, analytics tools, billing systems, and the people making roadmap calls. Keep that contract small, explicit, and enforced.
Key Analysis Frameworks for User Behavior
Once the data model is stable, the next job is analysis that changes decisions. Three frameworks do most of the heavy lifting for mobile teams: funnels, retention, and cohorts. They answer different questions, and teams get into trouble when they use one for all three.
Funnels show where journeys break
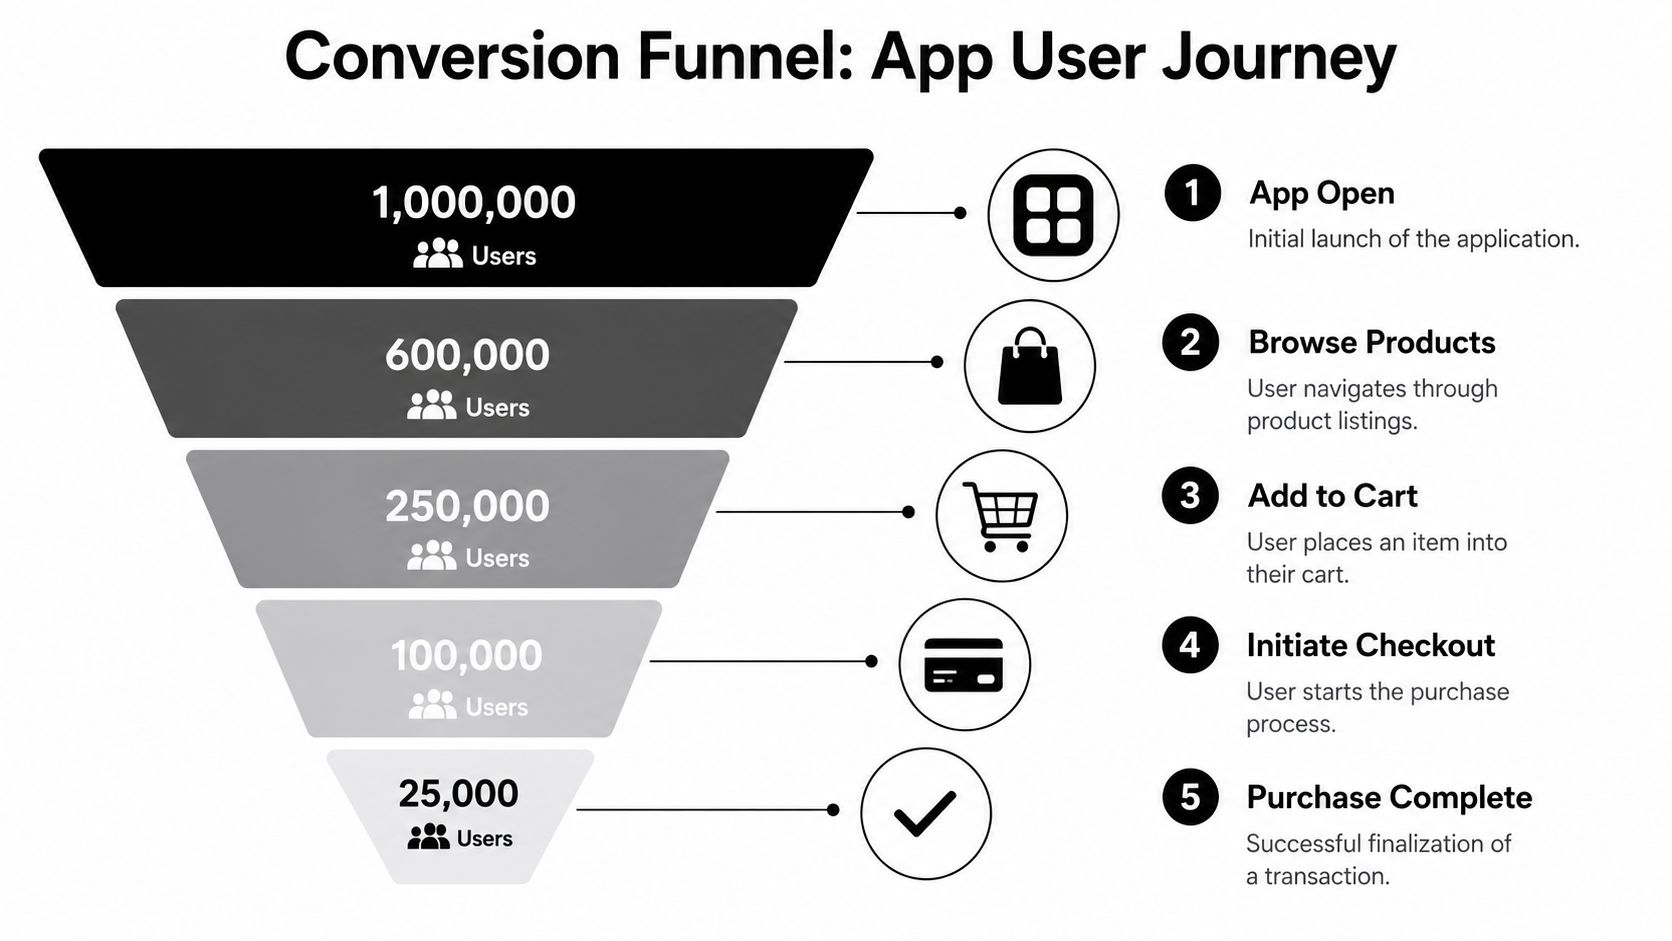
Use a funnel when you need to understand a fixed sequence. In a subscription app that might be:
- app opened
- onboarding completed
- paywall viewed
- trial started
- subscription activated
In ecommerce, it might be browse, add to cart, checkout started, purchase completed. In a game, it may be install, tutorial complete, store viewed, first purchase, second session.
Funnels are best when the path is narrow and the outcome matters. They tell you where users drop, but not why by themselves. Pair funnel steps with screen context, performance signals, and experiment variants. A funnel that drops sharply at checkout_started means very different things if the issue is pricing confusion versus purchase restore failure.
For teams building reporting layers, a shared metrics surface matters. Nuxie's dashboard and metrics documentation shows the kind of standardized metric definitions that help prevent one team from counting a “conversion” differently from another.
Retention tells you if the product earned another session
Retention is your clearest read on whether the experience created durable value. It's also where many teams overreact. A launch can spike usage briefly and still damage retention if the feature adds clutter, slows the app, or front-loads monetization pressure.
Apple's peer benchmarking is useful because it anchors the conversation in category reality. Top-performing iOS apps achieve Day-7 retention rates of 45 to 50% and average proceeds per paying user of $12.50 to $18.00 in the U.S. market, and falling below the 50th percentile often signals a need for optimization, according to the summary of Apple's Peer Group Benchmarking.
That benchmark shouldn't turn into blind target setting. A meditation app, a utility app, and a game have different rhythm and monetization patterns. But it does give PMs a useful external frame when internal teams normalize weak retention as “good enough.”
If retention is weak, don't start with reactivation campaigns. Start by checking whether users reached core value quickly and whether the app stayed stable enough to let them get there.
Cohorts tell you which changes mattered over time
A cohort groups users by shared starting condition. Install month. Campaign source. App version. First paywall viewed. First completed quest. That lets you compare behavior over time instead of averaging everything into one blended trend.
Cohorts are where product strategy gets sharper. You can compare:
- Users acquired from different campaigns
- Users who saw onboarding version A versus B
- Users who first converted through a default paywall versus a contextual offer
- Players who entered through a liveops event versus the base progression path
- Users on one client framework or app version versus another
Here's the practical distinction:
| Framework | Best question |
|---|---|
| Funnel | Where are users dropping in this sequence? |
| Retention | Are users coming back after initial value? |
| Cohort | Which user groups behave differently over time? |
Don't analyze all users as one population
Cross-platform teams especially need segmented analysis. React Native, Flutter, Unity, Unreal, native iOS, and native Android often behave differently because the rendering model, plugin quality, entitlement wiring, and release cadence differ. If you flatten all of that into one dashboard, you'll miss platform-specific friction.
This is also true for monetization. A paywall with good top-line conversion may still underperform for reactivated users, Android users, or players entering from a shop banner instead of a progression gate.
The best analysis framework is the one narrow enough to trigger a decision. If the output doesn't tell someone what to change next, the report is too broad.
Advanced Considerations Attribution Cross-Platform and Offline
Generic app analytics guides usually fall apart due to the messy nature of real mobile systems. Users go offline, switch devices, reinstall, restore purchases, arrive from paid channels, and interact through codebases that don't share the same UI primitives.
Attribution gets harder once privacy enters the room
Attribution sounds simple until you try to use it in product analysis. Marketing may prefer a last-touch view because it's easy to report. Product often needs a more nuanced lens because the install source doesn't fully explain in-app behavior. A user may arrive through one campaign, return through a push, and convert only after an in-app message or contextual paywall.
The practical takeaway is to store attribution context as durable metadata alongside product events, not in a siloed marketing report. Keep campaign source, deep link context, and reacquisition signals available to your funnel and retention analysis. If privacy constraints limit what you receive, work with the fields you can trust and avoid pretending precision where it doesn't exist.
Framework choice changes instrumentation
Cross-platform decisions affect more than developer velocity. They affect what you can observe cleanly.
React Native creates real native platform components for each UI element, inheriting native behavior, whereas Flutter paints pixels with its own engine for pixel-perfect replication but lacks the same deep integration with native system features, which is a meaningful trade-off for analytics instrumentation, as explained in this comparison of React Native, Flutter, and native apps.
That has practical consequences:
- Native iOS and Android: Best for deep OS integration, clean lifecycle hooks, and precise instrumentation around billing, permissions, and hardware-heavy flows.
- React Native: Strong when you want shared product logic and UI parity while still benefiting from native component behavior.
- Flutter: Strong for visual consistency and custom UI systems, but analytics hooks often need more deliberate placement because the rendering model abstracts native components.
- Unity and Unreal: Common in games and immersive app experiences, but you need a gameplay-aware event model, not a repurposed SaaS app taxonomy.
Offline analytics needs explicit design
Offline support is one of those implementation details everyone agrees with until they realize it changes event semantics. If a player completes a level offline, purchases later, and syncs after reconnecting, ordering matters. If a field rep completes a flow with weak connectivity, losing those events can erase the evidence you need to understand churn or support issues.
A sound offline strategy usually includes:
- Client-side queueing: Store events locally with timestamps and sequence IDs.
- Idempotent ingestion: Prevent duplicate processing when retries happen.
- Ordering logic: Preserve event order where product meaning depends on it.
- Failure visibility: Log dropped batches, stale queues, and sync errors as first-class technical events.
Offline support isn't a nice-to-have for analytics. It's part of data correctness.
Billing and entitlements complicate attribution too
Teams often discover this late. A user can click a campaign, open a paywall, background the app, restore purchases on another device, then return already entitled. If your analytics, billing, and entitlement systems don't reconcile cleanly, your conversion reporting will look contradictory.
That's why product analytics can't live in total isolation from commercial infrastructure. Event data needs to understand not just user action, but purchase and entitlement state transitions across providers and platforms.
Using Analytics to Drive Growth and Experimentation
Analytics without action becomes a reporting tax. Teams review dashboards, agree a problem exists, and then do nothing because shipping a test still requires a client release, a design sprint, and engineering time that's already committed elsewhere.
That's why the operating model matters as much as the charts. The winning loop is simple: detect friction, form a hypothesis, launch an experience change, measure impact, repeat.
Turn findings into testable hypotheses
A good hypothesis is tied to one observed behavior and one change in experience. For example:
- users reach the paywall before understanding the premium value, so a benefits-led screen may improve trial starts
- returning players ignore the shop because the entry point is generic, so a timed contextual offer may increase store engagement
- users stall in onboarding after permissions, so delaying the prompt until after value discovery may improve activation
- subscribers hit entitlement confusion after reinstall, so a clearer restore flow may reduce support and failed access attempts
The point isn't to make the hypothesis sound smart. It's to make it easy to disprove.
For teams running mobile experiments regularly, this guide to A/B testing for mobile apps is a practical reference for structuring variants, targeting, and readouts without turning every test into a bespoke engineering project.
Go beyond cosmetic tests
Button color tests rarely matter unless the underlying decision is already strong. The high-impact experiments are structural:
| Area | Strong test examples |
|---|---|
| Onboarding | step order, delayed permissions, quiz logic, first-value path |
| Monetization | contextual paywalls, offer sequencing, placement timing, restore visibility |
| Retention | winback screens, surveys, feature announcements, re-entry prompts |
| Games | shop timing, reward surfaces, progression gates, liveops moments |
Paywalls are one important use case here, but they're only one part of the broader growth system. The same experimentation discipline applies to onboarding quizzes, feature education, event promotions, and post-purchase messaging.
Separate correlation from causation
One of the biggest mistakes in app analytics is assuming your most-used features are your retention drivers. A critical gap in analytics is distinguishing whether feature usage causes retention or whether engaged users happen to use more features. Without careful timing analysis or experimentation, teams risk optimizing “power features” that are just correlates of stickiness, not drivers, as discussed in this mobile app analytics guide.
This shows up constantly. A highly retained user segment uses feature X, so the team invests in feature X. Later, nothing changes, because feature X was a symptom of engagement, not the cause.
The fix is straightforward in principle and harder in practice:
- Check timing: Did the feature usage happen before improved retention?
- Compare matched cohorts: How did similar users behave when they didn't adopt the feature?
- Run interventions: Increase exposure to the feature for one group and measure the outcome.
- Watch downstream metrics: Did the change improve retention, conversion, or entitlement continuity, not just feature opens?
Here's a product walkthrough that shows why this matters in practice:
AI-native systems change the speed of iteration
Modern growth stacks are shifting from passive analytics to operational systems that can analyze, target, and ship experiences quickly. That matters because the best insight is often time-sensitive. If you identify onboarding friction but need a full client release cycle to test a fix, the opportunity cost is high.
The teams that move fastest usually connect these layers:
- Analytics workspace for behavior and segmentation
- Experiment system for variant control
- In-app experience layer for remote UI and messaging
- Billing and entitlement data so monetization state is visible inside product analysis
When those layers are disconnected, you get reporting without impact. When they're connected, growth work starts looking less like quarterly redesigns and more like continuous product operations.
Implementation Validation and Choosing Your Stack
Implementation is where most app analytics programs either become reliable or become folklore. The stack matters, but validation matters more. A fancy dashboard built on bad event data will confidently tell you the wrong story.
Validate before anyone builds a dashboard
Do the first QA pass in staging and again in production with controlled internal traffic. Check every core event manually. Trigger it on iOS and Android. Confirm timestamps, properties, platform labels, anonymous IDs, user IDs, entitlement state, and experiment metadata.
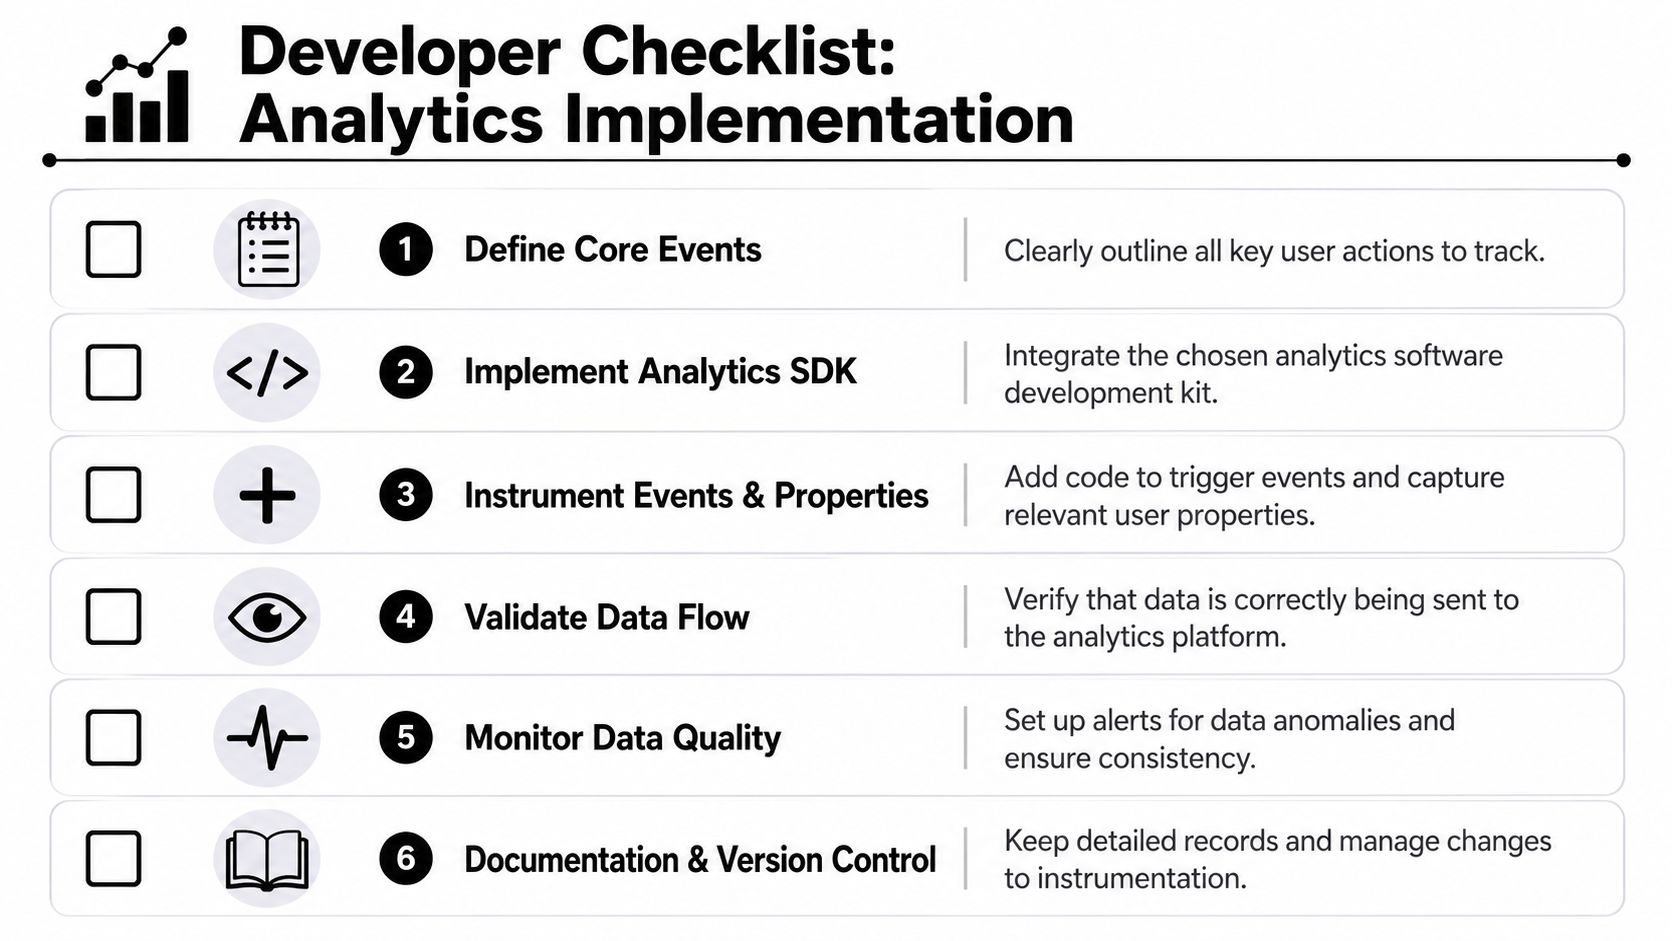
A practical validation checklist looks like this:
- Start with critical paths: onboarding, paywall view, purchase attempt, purchase success, restore, entitlement update, and key feature activation.
- Test identity transitions: anonymous to logged-in, reinstall, logout, account switch, and restored purchase.
- Check platform parity: make sure Swift, Kotlin, React Native, Flutter, Unity, and Unreal clients emit the same business events even if the implementation differs.
- Inspect raw payloads: don't rely only on dashboards. Validate the actual event payloads and ingestion logs.
- Create anomaly alerts: watch for sudden drops, spikes, missing properties, or a version shipping with broken instrumentation.
Bad analytics usually doesn't fail loudly. It drifts quietly after app updates, refactors, SDK changes, or billing edge cases.
Choose a stack that fits your architecture
Most mature teams don't use one tool for everything. They combine a product analytics layer, a crash or UX layer, attribution tooling, billing systems, and internal data pipelines. The key decision is whether those systems can share a stable identity model and event taxonomy.
For cross-platform mobile and game teams, choose tools that won't force a rip-and-replace when your architecture evolves. Provider-agnostic systems are usually safer than all-in-one products that require every part of your growth and monetization stack to move together.
That matters for billing and entitlements too. If you want purchase and access state available in analysis, experimentation, and in-app experiences, avoid infrastructure choices that lock your commercial data behind one vendor's workflow or fee structure.
Keep ownership clear
Instrumentation decays when nobody owns it. Give engineering ownership of implementation quality, product ownership of the tracking plan, and analytics or growth ownership of metric definitions. If everyone owns it, nobody does.
The best app analytics stack is the one your team trusts enough to act on. Trust comes from clean taxonomy, cross-platform consistency, and validation discipline. Everything else is secondary.
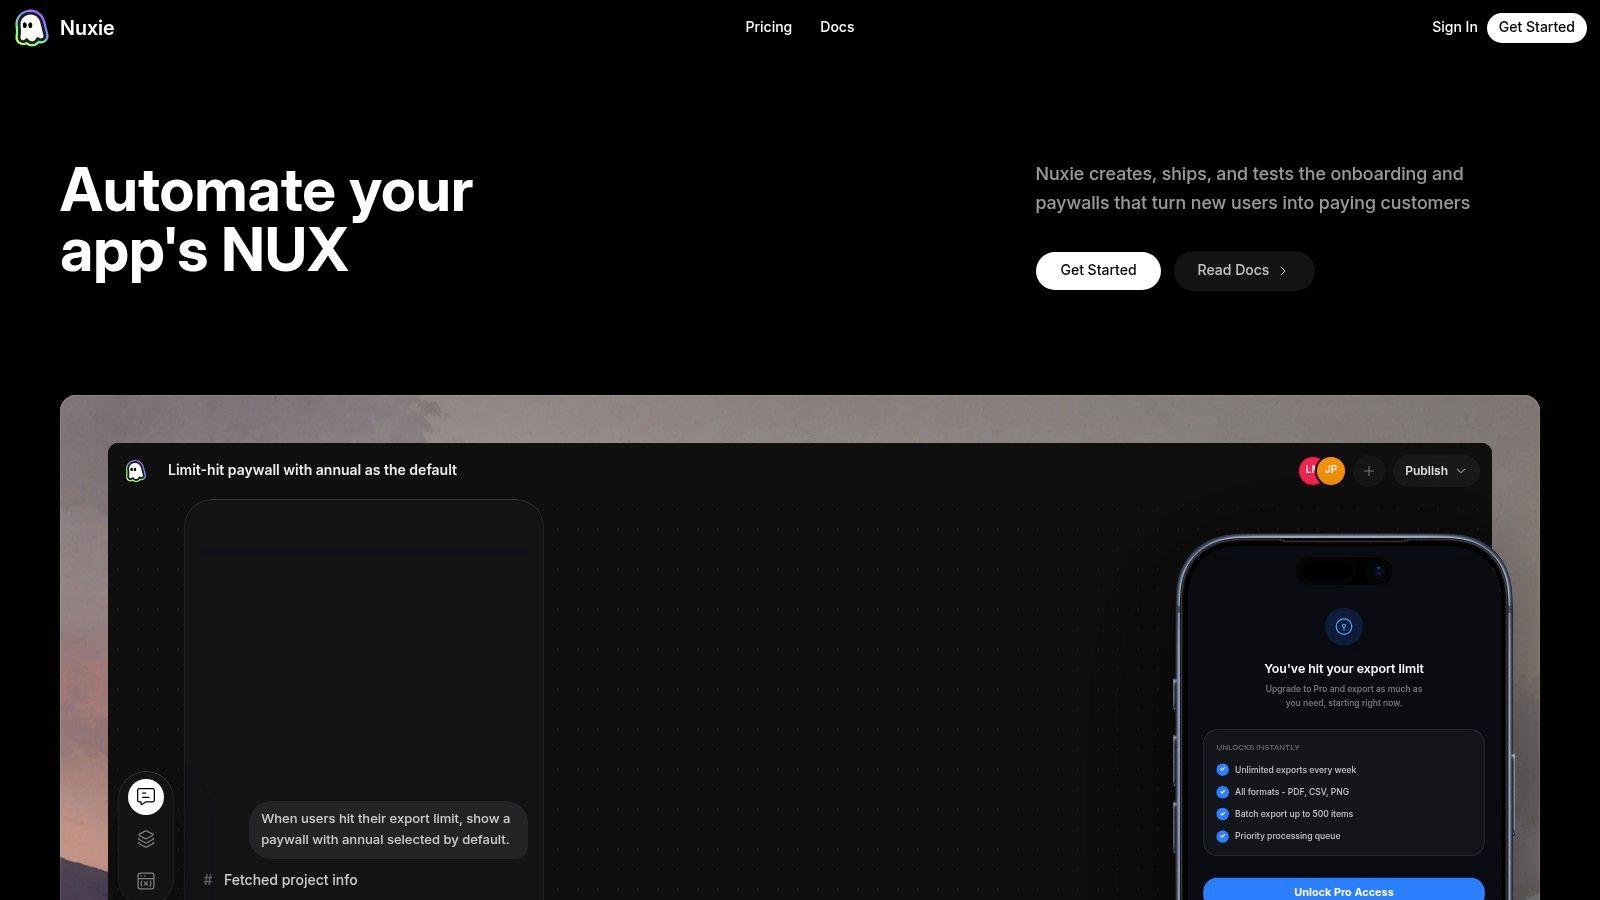
Nuxie is a strong fit for teams that want to connect analytics, experimentation, in-app experiences, billing, and entitlements without rebuilding their whole stack. It's an AI-native, provider-agnostic platform for mobile apps and games across iOS, Android, React Native, Flutter, Unity, and Unreal. Teams use Nuxie to design and ship onboarding flows, surveys, feature announcements, paywalls, retention offers, liveops moments, and personalized screens remotely, while keeping analytics and monetization data connected. It can work alongside existing tools and billing providers, or replace parts of that stack, and it doesn't charge a revenue-share fee for billing or entitlement data.